# All systems go for Caddy
In setting up this blog, I wanted to branch out a little bit from my standard approach of using nginx as my “default” http server. Why not try Caddy? I’ve heard good things & it’s written in golang, so yeah let’s give it a shot.
I’m also a metrics nerd & getting Prometheus metrics from my web server is a hard requirement.
As I was getting started, I found this line in the docs:
Note that a /metrics endpoint is also attached to the admin API, which is not configurable, and is not available when the admin API is disabled.
It left me with the impression that the only way to enable metrics was to also expose the admin interface.
Since this site has a CI pipeline and gets packaged into a container for deployment, there’s really no reason to have an API that enables live configuration editing. I just don’t need it. If I need to change Caddy’s config, I’ll just change it and deploy. Leaving Caddy’s admin API enabled gives me nothing except increased attack surface.
Luckily, someone else has had this problem, solved it, and wrote about it. <3 thank you, Jack.
My Caddyfile looks like this:
|
|
Not a ton going on. Lines 4-6 and 14-20 are how we enable metrics without the
admin interface. The gist is we turn off the admin interface with admin off,
tell Caddy to record metrics for all servers with servers { metrics } and then
define a new http server on port 9091 that serves metrics metrics /metrics.
Checking the logs to make sure we got everything right, we can see:
2023/03/10 20:08:17.268 WARN admin admin endpoint disabled
Good, and do we have metrics?
❯ curl -s localhost:9091/metrics | rg caddy_http_requests_total
# HELP caddy_http_requests_total Counter of HTTP(S) requests made.
# TYPE caddy_http_requests_total counter
caddy_http_requests_total{handler="metrics",server="srv1"} 2
Yes we do! This works. And now we have graphs:
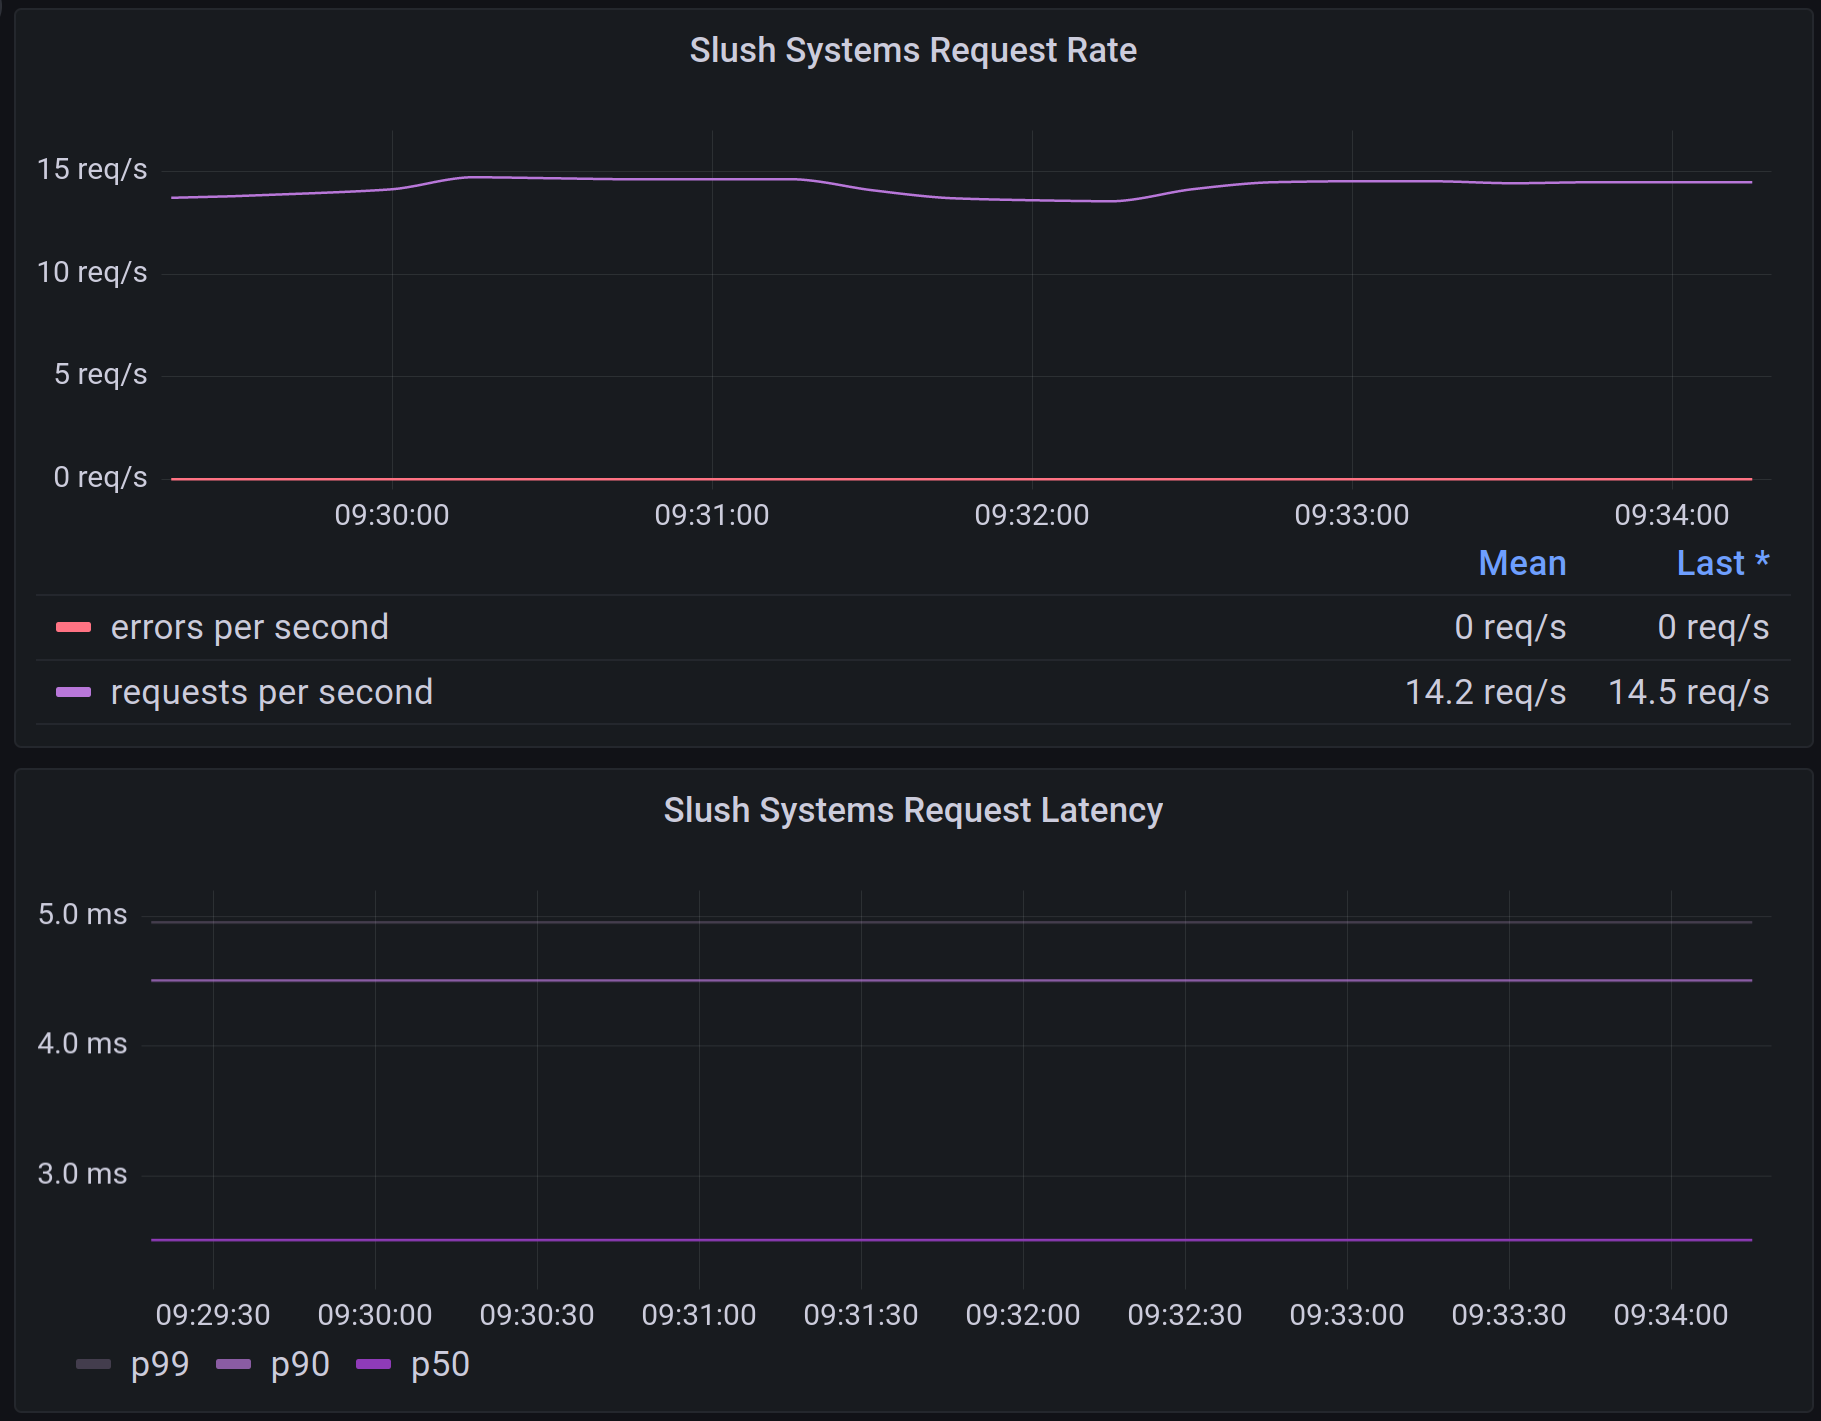
Yes, I did ab -n 10000 -c 2 https://slush.systems/ to generate the traffic for
that graph.